Hunting the Real Bitcoin Network Hashrate

Note: if you'd prefer to watch me deliver this research as a presentation with slides, you can watch my POW Summit keynote here.
“Proof-of-work has the nice property that it can be relayed through untrusted middlemen. We don't have to worry about a chain of custody of communication. It doesn't matter who tells you a longest chain, the proof-of-work speaks for itself.”And so the proof of work is its own self-contained piece of integrity."
- Satoshi Nakamoto
Proof of Work is a pretty simple mathematical construct where you can be given some data, run a quick verification check against it, and you can be assured that it has not been tampered with and that someone has expended a decent amount of computation to publish the data.
But Proof of Work is probabilistic. You can't look at a proof and know exactly how much time, money, cost, CPU cycles, etc were put into that proof. You can only get a rough idea. We know that there are a ton of machines out there mining these different proof of work networks like Bitcoin. But we can't precisely measure the amount of electricity and the amount of computational cycles that are going into these proofs.
Earlier this year I mused upon the difficulty in knowing an accurate measurement of the global hashrate. Many have tried and many have failed!
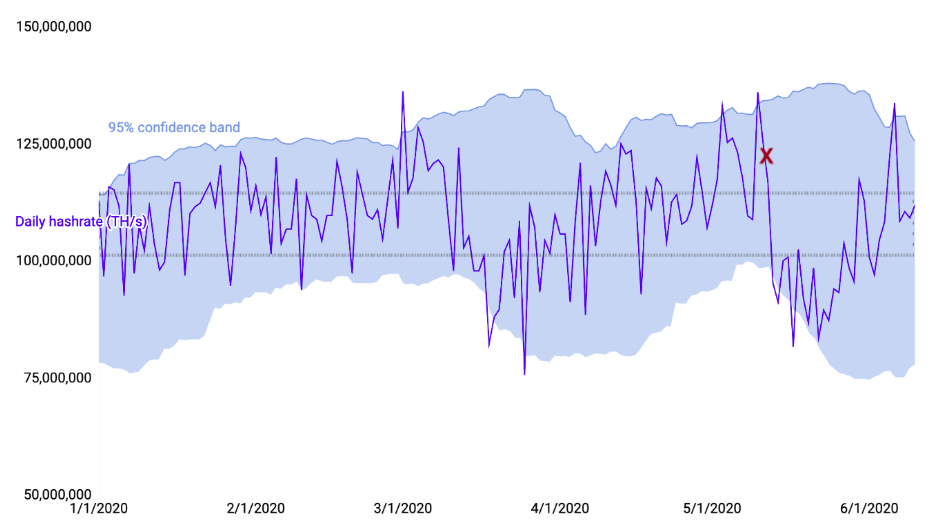
My prior essay delved into the volatility inherent to different hashrate estimates and showed why it's better to use estimates that are calculated over a longer time frame of data, preferably around 1 week of trailing blocks.
Motivation
My primary goal with this research is just to get us all on the same page. I often see folks making claims about changes to the hashrate as if they are news-worthy, but without mentioning how they are estimating the hashrate.
It's possible that large scale miners could be interested in an improved hashrate estimate for their own planning purposes, but I'm generally just seeking to reduce confusion with regard to this topic.
Hashrate Estimate Trade-offs
We can see that it's highly volatile if you're only using the past 10 blocks to generate a hashrate estimate, which is about two hours worth of data. But once you get up to around a three-day, 400, 500-block time frame, that starts to smooth out a bit more.
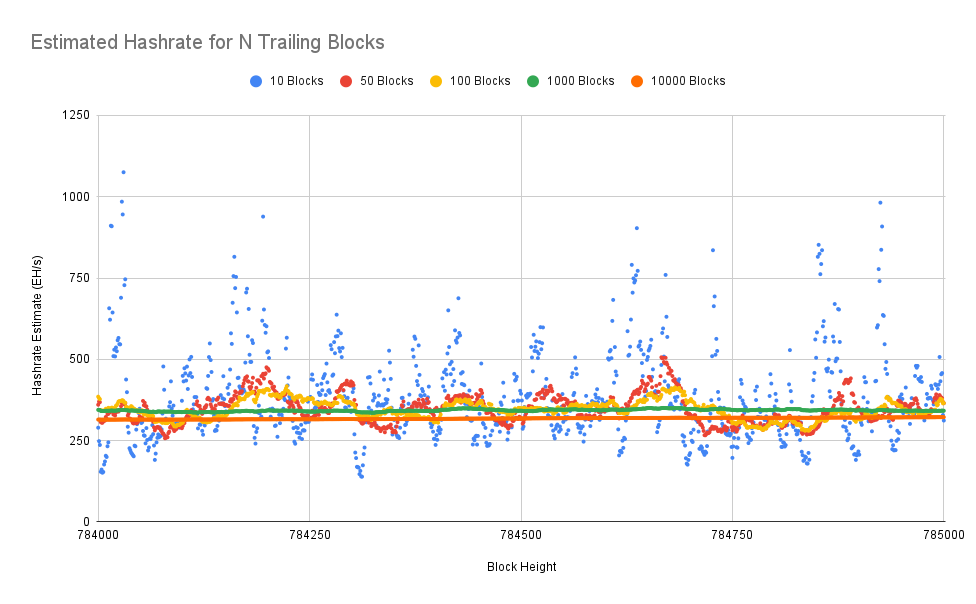
But the downside is these shorter time frames can have more distortion, more volatility. And they can make the hashrate appear a lot higher or a lot lower than it really is. So I think it's generally agreed that the seven-day, around the 1,000-block hashrate is a pretty good mixture between getting that volatility and getting something that is a bit more predictable and accurate.
The problem, though, as you can see, if you go out to multiple weeks of trailing data, while that is smoother, it's always going to be off by more. And that's because you start lagging whatever the real hashrate is. Because if you think about it, there are lots of miners out there that are constantly adding machines to the network.
I concluded my earlier essay with an area of potential future research: comparing realtime hashrate reported by mining pools against the hashrate estimates derived solely from trailing blockchain data. I feared that I'd have to start a lengthy process of collecting this data myself, but eventually discovered a data source. Thus, I set to work crunching some numbers!
You can find all the scripts I wrote to perform the analysis, along with the raw data in this github directory. The output data and charts are available in this spreadsheet.
Realtime Hashrate Data
If you're calculating hashrate estimates then you need to be only working off the data that is available to you in the blockchain that's publicly available to everyone. The problem with that is you have no external source that you can really check it against. And what I found earlier this year is that Brains mining pool has actually started to collect what they call the realtime hashrate.
For the past couple of years Braiins has been pinging every mining pool's API every few minutes. They then save the self-reported hashrate from that mining pool. Thankfully, the folks at Brains were kind enough to give me a full data dump of everything they had collected.
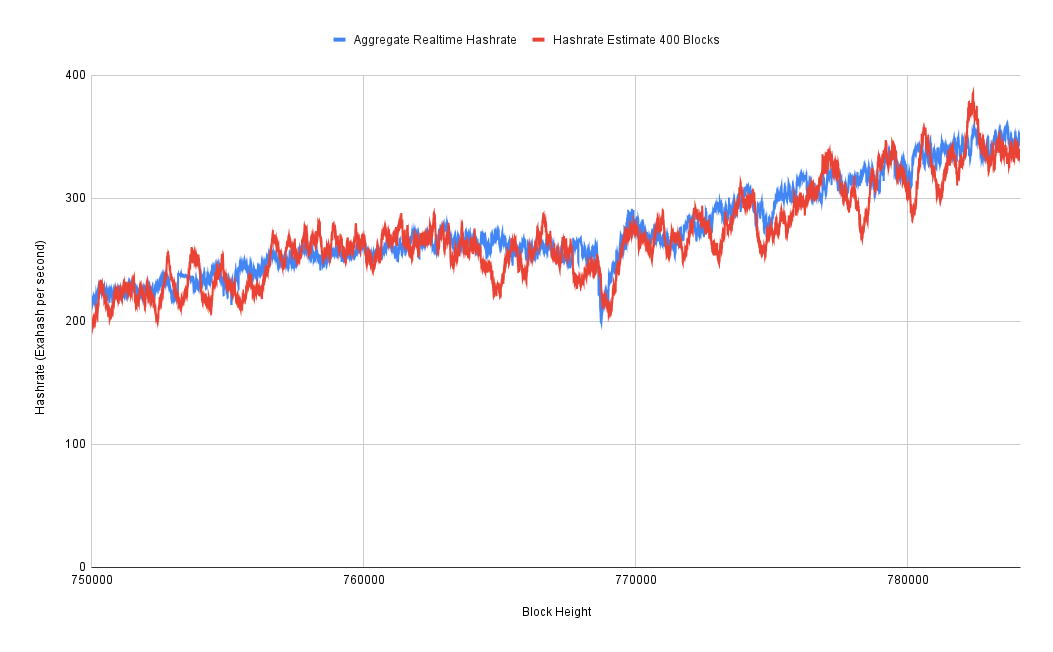
It was a pretty messy data set. I had to write a script to normalize the data and essentially chunk it into block heights so that I could line it up with blockchain-based estimates. I then plotted the sum of all the hashrates collected from all the pools.
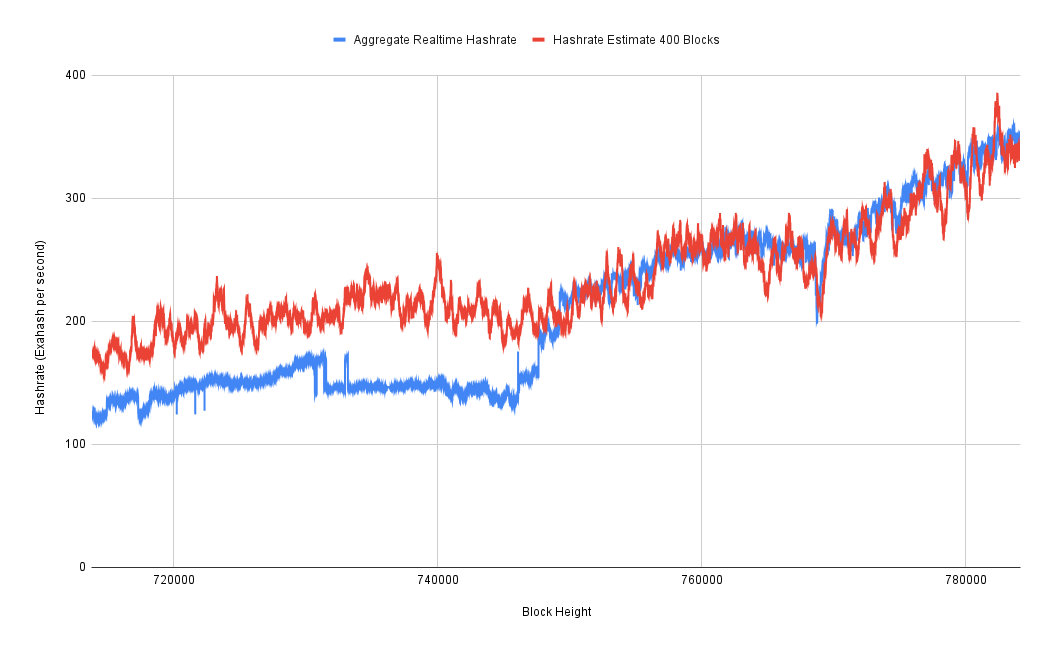
I plotted that against the three-day hashrate estimate and very quickly discovered that for the first year or so of this data set, it's very wrong. So my suspicion is that Braiins was not collecting data from all of the mining pools at first. But we can see that after that first year, it actually starts to line up pretty well. So it looks like they got to the point where they were, in fact, collecting data from all of the major mining pools. So this is what I have been using as my baseline hashrate that I can then perform various calculations upon to try to figure out how well these purely blockchain data-based hashrate estimates are performing.
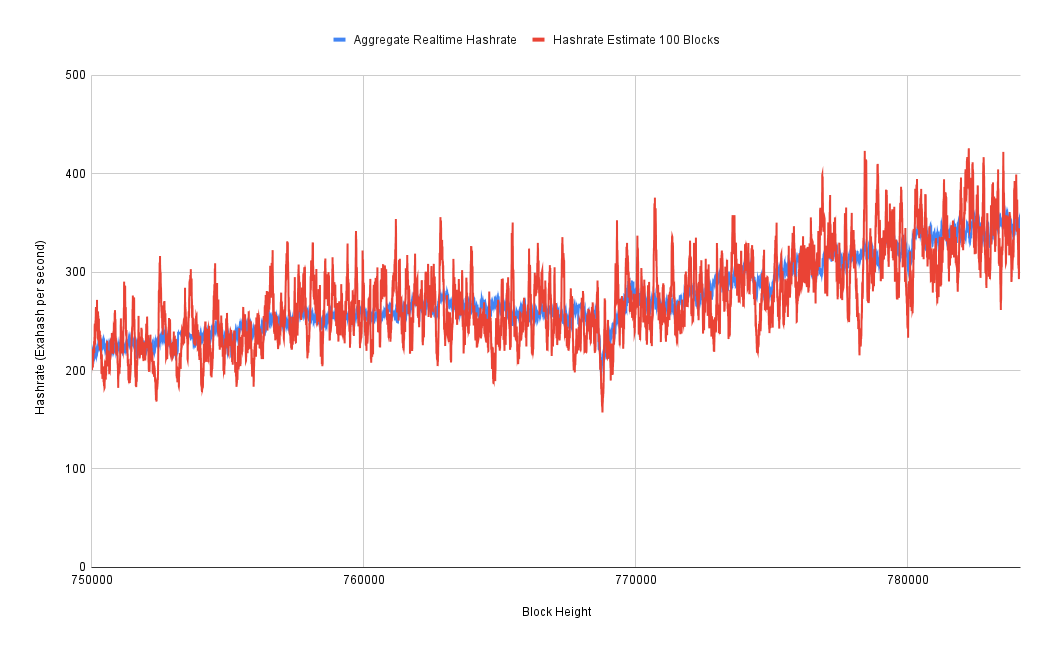
Now that we have a baseline for the "real" hashrate, I started calculating things like error rates between the estimates and the baseline. And as we can see here, the one block estimate is insanely wrong. You can be 60,000% off from whatever the real network hashrate is. This is essentially when a miner gets lucky and they find a block a few seconds after the last one. Obviously, that's not because the hashrate just went up by 60,000%. It's just luck. It has to do with the distribution of "winning" with the right "lottery numbers."
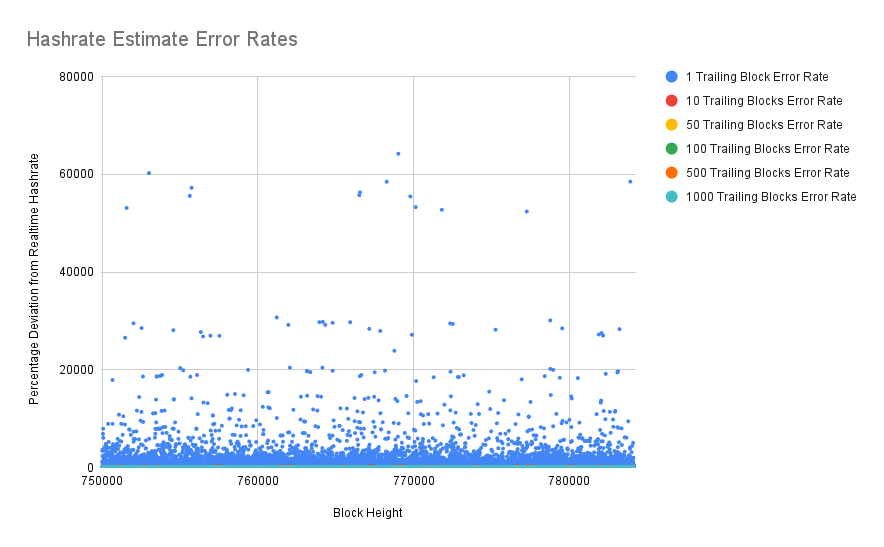
Thus we're going to throw out 1 block estimates. In fact, you can't even really see the error rates for other time frames on this chart. Let's zoom in.
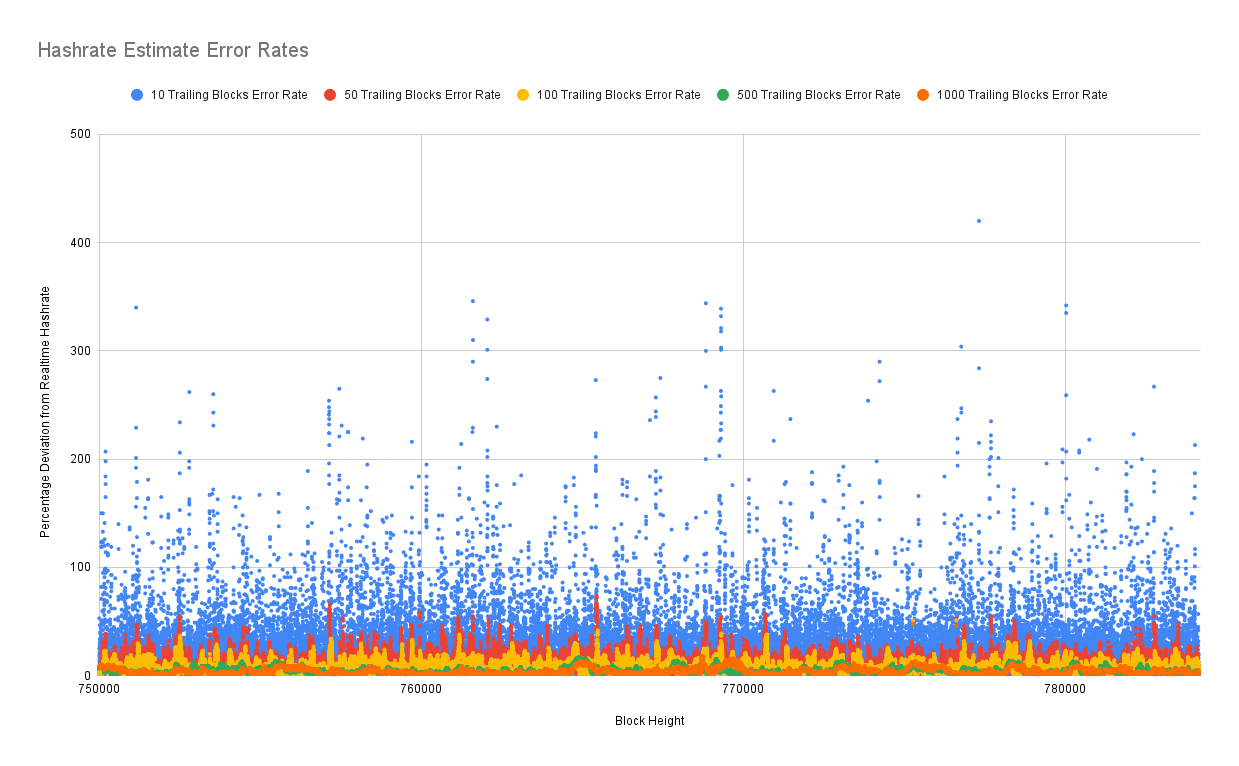
We can see with 10 block estimates, they're getting better. We're getting down to an error rate range within 300%, 400%. That's still pretty bad. That's still worse than that Kraken true hashrate that they did back in 2020. Let's zoom in some more.
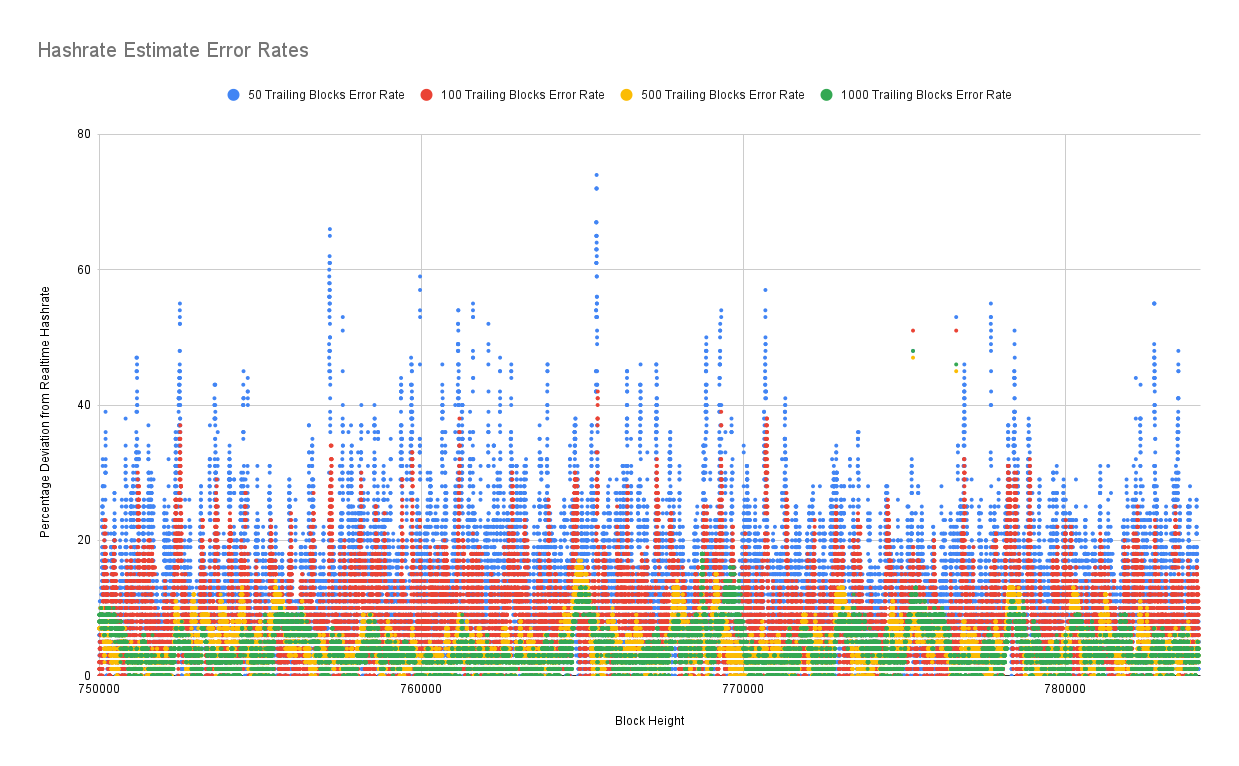
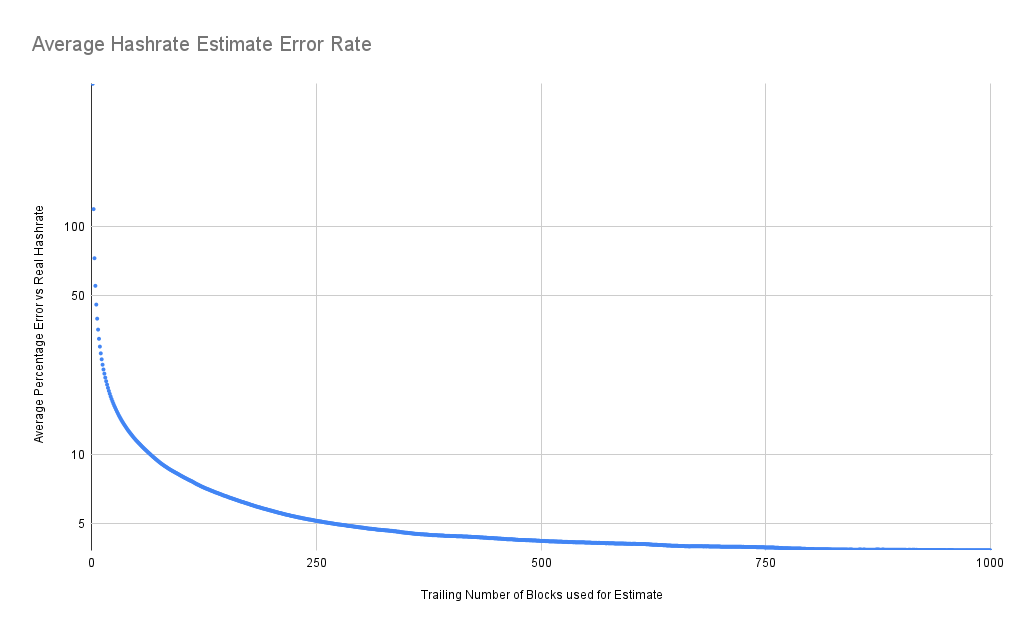
We get down to 50 blocks, and we're under 100% average error rates. Once we get into the 500 block range, half a week of trailing data, we can actually start to get error rates under 10%.
Average Error Rates
Let's plot out the average hashrate estimate error rate for this particular data set. The further out you go with your trailing data time frame, the better your error rate gets. But thankfully, I did not stop at 1,000 blocks. Because, as mentioned earlier, you get to a point where you start lagging behind the real hashrate by too much.
It gets interesting when you look at the 1,000 to 2,000 block estimates. And we can see here, eventually, you get around the 1,200 block, more than a week of data, and the error rate starts ticking up again. This is because the average point in our time frame is too far behind the current time. We can see that there's a sweet spot. Somewhere in the 1,100 to 1,150 block range of trailing data will give us the single best overall estimate.
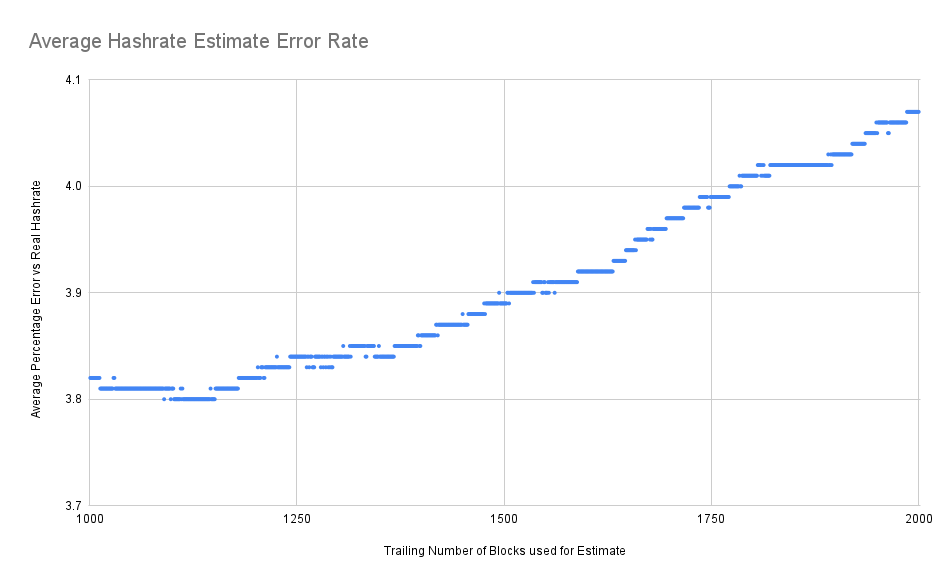
Why is the optimal trailing block target 1100 blocks? I think that's just a function of the hashrate derivative (rate of change) over the time period we're observing. If the global hashrate was perfectly steady then I'd expect the estimate error rate to asymptotically approach 0 as you extend the time horizon. But since the global hashrate is actually changing, it's a moving target. Apparently it was changing fast enough over our sample data set (in 2022-2023) that you experience noticeable lag after 1 week.
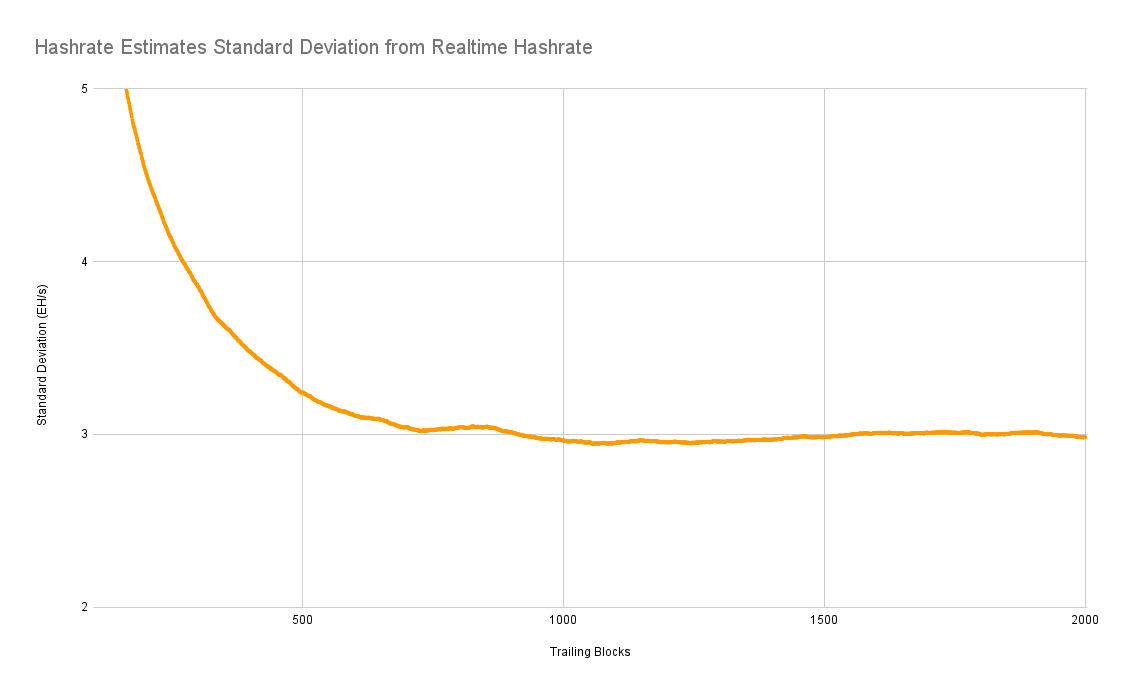
Similarly, if we look at the standard deviation, it pretty much matches up in terms of trying to find the optimal time frame of data to use. So we have an average error rate of under 4% with a standard deviation of under 3 exahash per second if you're using this 1,100 to 1,150 block trailing data, that's not bad. But I wondered, could we do better?
Can We Do Better?
An average error rate under 4% isn't terrible. What if we could blend the accuracy of a long-range estimate with the faster reaction speed of a short-range estimate?
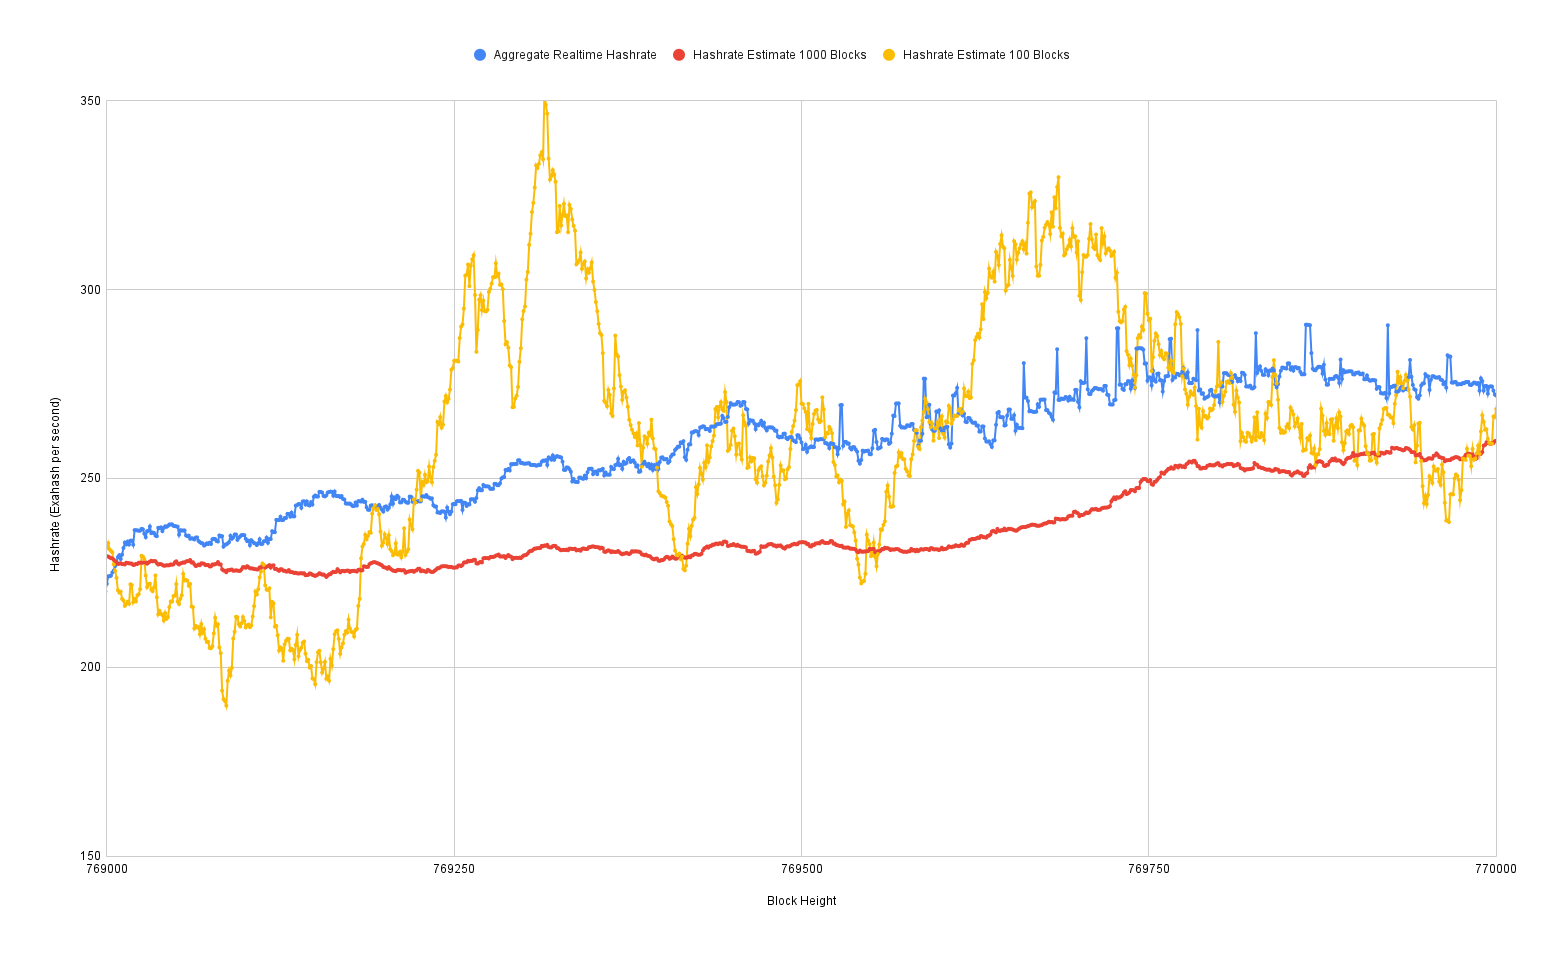
I wondered if we could find an algorithm that uses the baseline estimate of 1100 trailing blocks and then uses some combination of other estimation data to adjust the estimate up and down based upon a shorter time window or even derivative of recent estimates.
We know that the standard deviation for the trailing 100 block estimate is a little over 6% error rate. What if we compared the 100 block estimate to the 1100 block estimate and ignored any discrepancies under 6% as noise in the volatility? Then we could apply a weight to the 100 block estimate to adjust the 1100 block estimate up or down.
Exploring Blended Estimate Algorithms
Next I wrote yet another script to ingest the data output by my hashrate estimate and realtime hashrate scripts, but to effectively brute force a bunch of possible combinations for weighing a blend of different estimate algorithms. Those results were then compared to the realtime hashrate data to see if they had higher accuracy and lower standard deviation.
My initial test runs were only blending the 100 block and 1100 block estimates and iterated through combinations of 3 different parameters:
- $trailingBlocks // to reduce volatility, check the short term estimate over a trailing period from 10 to 100 trailing blocks
- $higherWeight // when the short term estimate is 1+ standard deviation higher than the long term estimate, test weighting it from 100% to 0%
- $lowerWeight // when the short term estimate is 1+ standard deviation lower than the long term estimate, test weighting it from 100% to 0%
Since these scripts tried so many permutations, I ran a bunch of them in parallel and bucketed each run by the first parameter. My final output from 10 runs resulted in over 5 million data points. The most accurate parameters from each run are below:
| Trailing Blocks | Higher Weight | Lower Weight | Error Rate | Std Dev |
|---|---|---|---|---|
| 19 | 20% | 20% | 5.11% | 4.48 |
| 29 | 20% | 20% | 4.92% | 4.25 |
| 39 | 20% | 20% | 4.82% | 4.13 |
| 49 | 20% | 20% | 4.77% | 4.04 |
| 59 | 20% | 20% | 4.72% | 3.95 |
| 69 | 20% | 20% | 4.68% | 3.88 |
| 79 | 20% | 20% | 4.66% | 3.83 |
| 89 | 20% | 20% | 4.65% | 3.79 |
| 99 | 20% | 20% | 4.63% | 3.77 |
Remember that our baseline to beat is the 1100 trailing block estimate with an average error of 3.8% and standard deviation of 2.95 EH/s.
We haven't found a strictly better estimate algorithm yet, but we can see some trends. It seems like when you use a hashrate estimate for a given period (like 100 blocks) then if you look at that same estimate for the past period, you gain greater accuracy. So what if we try blending estimates from 100, 200, 300... 1100 blocks all together and give them each an equal weight?
- Average Error Rate: 3.75%
- Standard Deviation: 2.95 EH/s
Not a significant improvement. Next I tried setting a cutoff threshold for shorter term estimates that were lower than the longer term estimate; I'd throw them out if the estimates were only below the long term estimate for a given percentage of recent trailing block windows. I quickly discovered that the greatest accuracy improvement came from throwing out short term estimates that had less than 100% of recent estimates below the long term estimate.
- Average Error Rate: 3.39%
- Standard Deviation: 2.62 EH/s
Here you can see the blended estimate in purple, generally following along the long-range baseline but occasionally getting pulled upward when the shorter term estimates are significantly higher.
A Better Blended Estimate Algorithm
In case anyone wants to try using my optimized blended estimate algorithm, I've written example scripts in both PHP and bash (Linux.)
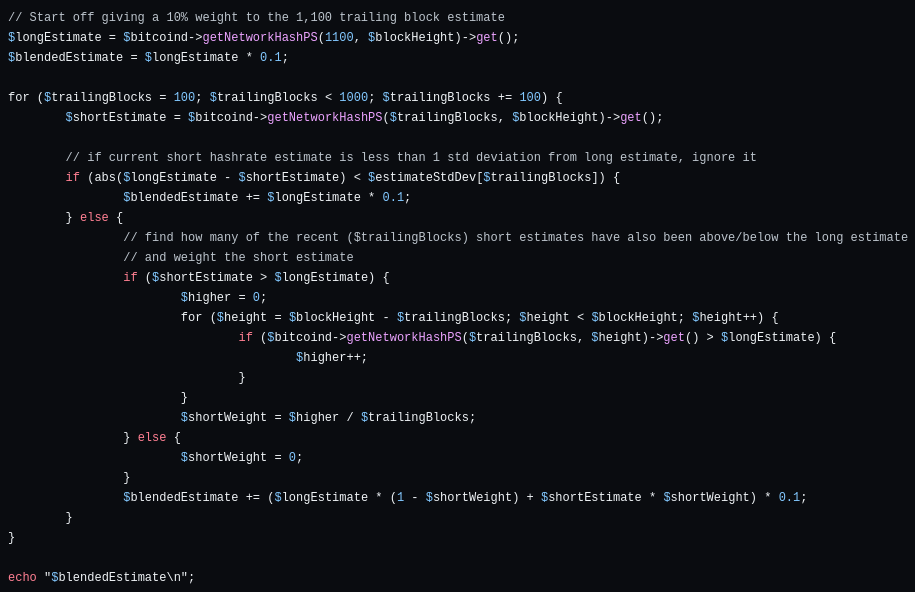
A single blended estimate makes between 10 and 4,500 RPC calls depending on if the current estimates are more than 1 standard deviation away from the 1,000 block estimate. These 10 different baseline estimates are then weighted based off of many other recent estimates being either above or below the 1,000 trailing block estimate. While that makes it relatively slow, on my laptop a single hashrate estimate RPC call takes ~2 milliseconds to complete; my improved estimate algorithm takes between 0.05 and 20 seconds to complete.
In Summary
Most web sites that publish hashrate statistics seem to use the 1 day trailing average (6.7% average error rate), which makes sense give that Bitcoin Core's default is to use 120 trailing blocks for the estimate (7.3% average error rate.)
Savvier sites report the 3 day average (4.4% average error rate) while the best sites use the 7 day average (3.8% average error rate.)
For the time period checked the ~1120 trailing block estimate is optimal with an average error of 3.8% and standard deviation of 2.95.
By blending together many hashrate estimates and weighting them based upon recent estimates with a variety of trailing data time frames we were fairly easily able to improve upon the 1100 block estimate and decrease the average error rate by 13% and lower the standard deviation by 14%.
Caveats & Future Work
This is by no means the optimal algorithm; there's plenty of room for improvement. Some of the issues at play with my approach:
- Assumes accuracy of pool reporting
- Assumes pools don’t share hashrate
- Assumes accuracy of Braains' data collection
- Estimate algorithm is ~1000X more computationally complex
The realtime data set itself is relatively small - less than a year in length; the more training data you can feed to a "best fit" search algorithm, the more accurate the results should be. Hopefully once we have several years of data that crosses halvings and other major events, it will be even better.
AI data processing on a GPU would likely yield improved results and would be able to churn through far more possibilities of blending data.
Proof of Work is a fascinating phenomenon, and we're clearly still trying to fully understand it!


