Bitcoin 2019 Annual Review

I’ve always been fascinated with the raw numbers relating to the operational status and growth of Bitcoin, especially as we ride the rollercoaster of the adoption life cycle. It’s why I created Statoshi.info in 2014 to track bitcoin metrics from the perspective of a full node.
To that same end, I’ve compiled statistical measurements of Bitcoin’s growth in 2019 from a variety of sources. It is difficult to see all of the moving pieces since the data is so distributed, but the picture becomes more clear when you bring them all together.
The one theme that I've taken away from all of these metrics is that 2019 was a quiet year for Bitcoin. Some metrics show continued pullback from the previous hype cycle while others are fairly flat, while some show modest growth. 2019 was a year of building; I expect the efforts expended in 2019 to yield results in the coming years.
Bitcoin is at the forefront of an increasingly complex ecosystem that continues to grow in a variety of ways. And for the 11th straight year, it stubbornly refused to die - though it would be premature to predict the death of Bitcoin obituaries!
Bitcoin obituaries proclaimed per year:
— Jameson Lopp (@lopp) December 22, 2019
2010: 1
2011: 6
2012: 1
2013: 17
2014: 29
2015: 39
2016: 28
2017: 124
2018: 93
2019: 40https://t.co/K8Gna8iA4D
General Interest
Relative search interest remains high in developing countries.
Countries with the most relative search interest for Bitcoin in 2019. Nigeria has risen from 5th to 1st place since 2018. https://t.co/Wgrqev6fP7 pic.twitter.com/pWhDGz0x1G
— Jameson Lopp (@lopp) December 22, 2019
General interest in educational resources remained low.
Daily visitors to https://t.co/wFS8qxd2FT stayed steady throughout 2019, averaging 250 per day and continuing the trend seen since mid-2018. pic.twitter.com/hfF37vpKA9
— Jameson Lopp (@lopp) December 23, 2019
As usual, exchange rate spikes tend to result in a feedback effect of inciting more interest.
The rate of new subscribers to the /r/bitcoin subreddit accelerated after the exchange rate jumped this summer. It grew in size by 222,000 users - 22% growth in 2019. pic.twitter.com/9q0bASk2C3
— Jameson Lopp (@lopp) December 23, 2019
Academic Interest
Academic interest continued to increase, which is great for the long-term prospects of this industry as we continue to gain a greater understanding of what we’re building.
Google Scholar articles published mentioning Bitcoin:
— Jameson Lopp (@lopp) December 23, 2019
2009: 83
2010: 136
2011: 218
2012: 424
2013: 868
2014: 2,070
2015: 2,820
2016: 3,380
2017: 6,460
2018: 11,500
2019: 13,700 (will ⬆️ due to listing lag)
Cryptology ePrint Archive papers mentioning Bitcoin:
— Jameson Lopp (@lopp) December 23, 2019
2011: 1
2012: 3
2013: 8
2014: 18
2015: 20
2016: 26
2017: 24
2018: 26
2019: 20
Funding and Forking
Venture capital funding was down 18% year over year - from what I've heard it's mostly due to a cooling off on the "blockchain solves everything" hype.
Blockchain industry venture capital funding:
— Jameson Lopp (@lopp) December 23, 2019
2012: $2M
2013: $120M
2014: $368M
2015: $601M
2016: $597M
2017: $876M
2018: $3,127M
2019: $2,555M
The red hot ICO market crashed by 85% year over year as many overfunded overhyped projects failed to deliver on their promises.
Funds raised via ICOs:
— Jameson Lopp (@lopp) December 23, 2019
2014: $30M
2015: $9M
2016: $257M
2017: $6,558M
2018: $21,621M
2019: $3,255M
Although BTC's exchange rate doubled over the course of the year, volatility was fairly low.
Bitcoin's exchange rate volatility stayed relatively low throughout 2019, hovering around 4% for trailing 30 and 60 day price changes. https://t.co/KmrSmVDdow pic.twitter.com/eAete7o4Je
— Jameson Lopp (@lopp) December 26, 2019
As we’ve seen several times over Bitcoin’s history, crashes cause flight from more speculative crypto assets to the relative “safe haven” of BTC, which results in the relative share of the market value going up. Bitcoin doubled in price during 2019 but many altcoins were either flat or in the red, increasing its "dominance" even further.
Bitcoin market cap dominance (a highly manipulable metric of questionable value) rose nearly 20% throughout 2019, extending and doubling the gain seen in 2018. The combined market caps of the thousands of altcoins does not even reach half that of Bitcoin. pic.twitter.com/3VNPxFD75a
— Jameson Lopp (@lopp) December 26, 2019
On-Chain Transactions
While development of Lightning Network made significant progress in 2019, which I’ll cover later on, due to its stronger privacy features we’ll always have more accurate statistics of on-chain activity.
Daily on-chain bitcoin transaction volume peaked at $20B/day, 10X where it began 2019. It's now around 2X, roughly mirroring the exchange rate movements. https://t.co/StrU94W9ik pic.twitter.com/UG8CDTwcbd
— Jameson Lopp (@lopp) December 27, 2019
Daily on-chain bitcoin transaction volume remained fairly flat in terms of BTC during 2019. https://t.co/BwUIGnklh3 pic.twitter.com/ZODp2XUVyo
— Jameson Lopp (@lopp) December 27, 2019
Daily bitcoin transaction outputs also generally trended along with the exchange rate during 2019. https://t.co/9f6shMikYh pic.twitter.com/fTS2Tx4bY2
— Jameson Lopp (@lopp) December 27, 2019
A more controversial aspect of the changing nature of bitcoin is the transaction fees. Rising fees caused significant frustration for users trying to transact in smaller amounts of value during late 2017 and early 2018, but they have since fallen off a cliff due to a variety of factors. Lower transaction demand, improved fee estimation algorithms, adoption of segregated witness, transaction batching, and lightning network have resulted in more efficient use of block space and less contention for this scarce resource.
Transaction fees collected by Bitcoin miners saw some wide swings in 2019, averaging $100,000 a day during quiet periods but spiking to $2,000,000 per day during busy times. The 2019 fee spike was still less than 10% of the highest fee days seen in 2018. https://t.co/PhwRf7cZiN pic.twitter.com/YSYsxijvSi
— Jameson Lopp (@lopp) December 28, 2019
Bitcoin address reuse, which is a poor privacy practice, declined in the second half of 2019 after rising 12% over the previous 18 months. https://t.co/OA3oIhHeIj pic.twitter.com/QoGidDNNsH
— Jameson Lopp (@lopp) December 28, 2019
Wen SegWit? 2019! Bitcoin transactions spending SegWit outputs increased another 20% this year and now the majority of transactions spend SegWit outputs. https://t.co/iIUVZzU9DU pic.twitter.com/3xXAtJg3q8
— Jameson Lopp (@lopp) December 28, 2019
UTXO set growth went back to 2017 levels, reversing the downward trend seen in 2018.
Bitcoin's UTXO set rose from 49.6M to an all-time high of 64.5M, adding a net new UTXO every 2 seconds. https://t.co/temn8DGaEy pic.twitter.com/oz4dxRPBTj
— Jameson Lopp (@lopp) December 30, 2019
Bitcoin Data Anchoring
While you may think of bitcoin as being a cryptocurrency, some users think of it as a trust anchor. By embedding data into Bitcoin’s blockchain, other systems can gain new properties such as tamper evidence and immutability.
The amount of outputs that embedded data into the blockchain increased at an unprecedented rate in 2019, mostly due to Veriblock's "proof of proof" mining coming online. It will be interesting to see if this is sustainable during periods of higher demand for block space that cause transaction fees to rise significantly.
Bitcoin OP_RETURN (data anchor) outputs created in:
— Jameson Lopp (@lopp) December 28, 2019
2014: 13,000
2015: 655,000
2016: 1,040,000
2017: 2,253,000
2018: 6,750,000
2019: 28,200,000https://t.co/BT3s4PcSGP pic.twitter.com/XpWBblrlCj
.@Omni_Layer was displaced as the most-used OP_RETURN protocol in 2019 as @VeriBlock was used to create 57% of new OP_RETURN outputs. https://t.co/dRYqHkCeDj pic.twitter.com/d7S4899gxW
— Jameson Lopp (@lopp) December 29, 2019
But OP_RETURN isn’t the only way to anchor other systems onto Bitcoin’s blockchain. Sidechains use pegging mechanisms to cryptographically lock BTC on the main chain and then allow users to unlock a proportional amount of tokens on a sidechain. This allows for experimentation with other features that are unlikely to be added to the Bitcoin protocol. At time of writing the only two production sidechains are RSK and Liquid.
The Bitcoin hashpower that is merge mining the @RSKsmart sidechain increased from 40% to 57% in 2019 https://t.co/1CqEJ4o92h
— Jameson Lopp (@lopp) December 31, 2019
The amount of BTC currently pegged into RSK stands at 162.4 https://t.co/MgPzrAfYdh
During 2019 the amount of BTC pegged to the Liquid sidechain increased from 42 to 96. https://t.co/kexKUSOCep pic.twitter.com/MszgGfxYP9
— Jameson Lopp (@lopp) January 4, 2020
Lightning Network
The network grew a ton in 2018 and then grew even more during the first half of 2019 before pulling back slightly. Though it's also becoming more difficult to know how accurate the metrics are for Lightning Network as more channels are being created privately.
During 2019 the number of advertised Lightning Network channels increased by 74% while the amount of BTC in those channels increased by 63% and their USD value increased 120%. Unadvertised channels and their value can't be measured. https://t.co/9gTKae87st pic.twitter.com/0fewQJl64Q
— Jameson Lopp (@lopp) December 30, 2019
The number of "cut channels" on Lightning Network increased from 22% to 32% during 2019. These are channels which, if removed, would prevent nodes from being connected to the rest of the network via other known, advertised channels. https://t.co/v84qSzZen6 pic.twitter.com/xBQBTFz2jw
— Jameson Lopp (@lopp) December 31, 2019
The "density" of advertised Lightning Network channels declined throughout 2019. I assume 100% density would mean that every node has a channel open to every other node, thus it would make sense for density to decrease as the size of the network increases. https://t.co/eP9lxSeS26 pic.twitter.com/sKHHR5YrQZ
— Jameson Lopp (@lopp) December 31, 2019
Network Security and Health
The number of reachable nodes didn’t fall much in comparison to the unreachable nodes — my suspicion is that people who run reachable nodes are highly dedicated to Bitcoin and/or using them for economic purposes, thus they are unlikely to turn off the node due to exchange rate volatility.
Reachable Bitcoin node count dropped by 8% during 2019 according to Bitnodes. https://t.co/R9VBt6kghW pic.twitter.com/EVVmvxFsaU
— Jameson Lopp (@lopp) December 31, 2019
According to @LukeDashjr's estimates of unreachable / non-listening node counts, the total number of Bitcoin nodes fell 22% from 65,000 to 50,500 during 2019. https://t.co/LwwSVN2y5T pic.twitter.com/2FmeOU7wVi
— Jameson Lopp (@lopp) December 31, 2019
The sharper drop in unreachable nodes makes sense if many of these were newcomers to Bitcoin during the summer exchange rate spike, who had installed Bitcoin Core (on a home computer behind a router) to use as a wallet and then lost interest when the price fell.
A variety of improvements in block propagation have been implemented by Bitcoin Core over the past couple years and we appear to have leveled off on network propagation performance in 2019.
After massive improvements in previous years, Bitcoin block propagation has settled at ~435 milliseconds for new blocks to reach the majority of nodes on the network. https://t.co/R9VBt6kghW pic.twitter.com/MBSPsXN0tZ
— Jameson Lopp (@lopp) December 31, 2019
Given that the exchange rate doubled, it's not surprising to see the hashrate more than double. Continued improvements in hardware efficiency also serve to lower the electricity required to achieve a given hashrate.
Bitcoin's network hashrate increased by 162% during 2019, from 38 to 100 exahash per second. https://t.co/fm3inll7uV pic.twitter.com/WiloJcJsk8
— Jameson Lopp (@lopp) December 31, 2019
Use of AsicBoost also serves to increase miners' electrical efficiency.
Bitcoin blocks mined with overt "version-rolling" AsicBoost increased from 32% to 63% during 2019. https://t.co/DS7eatUoRQ pic.twitter.com/C4UDGaWw4z
— Jameson Lopp (@lopp) December 31, 2019
The amount of time it would take for an attacker with 100% of the current hashrate to rewrite the entire bitcoin blockchain dropped by 100 days due to the accelerating hashrate in 2019 but has recovered half of that recently. https://t.co/fm3inll7uV pic.twitter.com/loyMHhAPq2
— Jameson Lopp (@lopp) December 31, 2019
Bitcoin's thermodynamic security accelerated at an average rate of 2,051 GH/s^2 in 2019. https://t.co/BTAAh13Bet
— Jameson Lopp (@lopp) December 31, 2019
In terms of general ecosystem security, we've been doing a lot better than in early years!
In the first few years of Bitcoin's operation, security practices were not that great. If you know of any bitcoin thefts I'm missing from this sheet, let me know. https://t.co/gdSKj6cvEy pic.twitter.com/Tw4GiLWvo4
— Jameson Lopp (@lopp) December 17, 2019
Cost of Node Operation
Anyone who has been following the Bitcoin space for long is likely aware of the scaling debate that resulted in a variety of both software forks and blockchain forks. The good news for node operators is that it appears the resources required to fully validate the entire history of the blockchain are decelerating, meaning that node operators should be able to take advantage of the deflationary nature of technology.
I ran performance tests of every Bitcoin client and sync time actually decreased or remained steady (linearly increasing along with the total blockchain size) for all but one client.
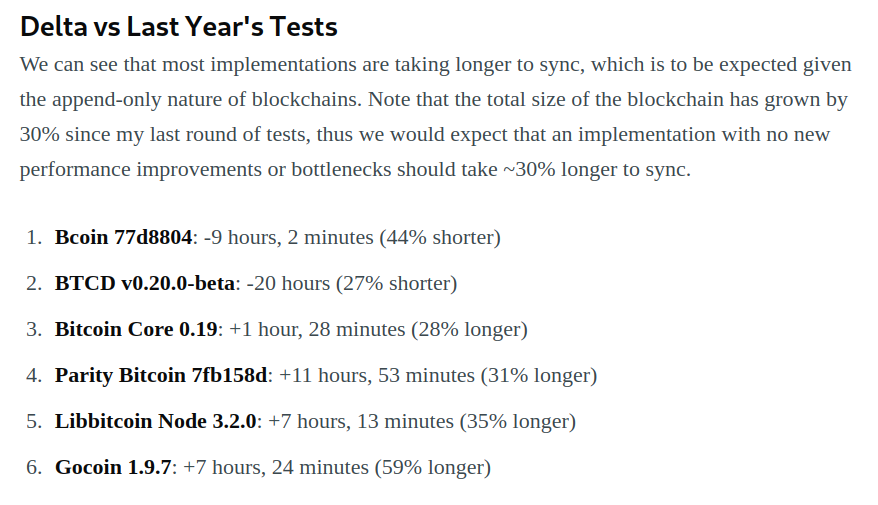
In terms of total storage required, the annual blockchain growth rate is now down to 20%, which ought to be easily addressed by increasing hard drive density. And of course you can always run a pruned node (though it will still have to download all of the data during the initial sync) that only needs 10 GB or so.
During 2019 the Bitcoin blockchain grew from 198 GB to 256 GB and the annual growth rate dropped from 25% to 20%. https://t.co/DPUJ8meguX pic.twitter.com/L57ZJU1I0J
— Jameson Lopp (@lopp) January 1, 2020
Bitcoin Economics
As usual, many of Bitcoin's economic metrics were correlated to the exchange rate, which was fairly flat throughout the year.
There was a spike during the exchange rate run-up, but otherwise the average value transferred per bitcoin transaction started and ended the year around $5,000. https://t.co/ygJyNKtN0H pic.twitter.com/wd56ak8Xb0
— Jameson Lopp (@lopp) January 1, 2020
https://t.co/vFLd6EtIff estimates (by removing likely change outputs) that $363B was transferred via bitcoin in 2019, averaging $11,500 per second. https://t.co/zg8Y3dMRJg pic.twitter.com/owRLf9XULt
— Jameson Lopp (@lopp) January 1, 2020
Transaction volume in terms of BTC remained rather flat during 2019. This can also be seen in blockchain.com’s chart.
We saw yet again in 2019 that the value of UTXOs consumed (spent) appears to be uncorrelated with bitcoin's exchange rate. Spending velocity averaged 16 BTC per second, barely more than 2018's 13 BTC per second. https://t.co/oQDgcJz4GO pic.twitter.com/60IyxKUUmK
— Jameson Lopp (@lopp) December 30, 2019
In terms of M1 Money Supply, Bitcoin made more modest gains.
During 2019 Bitcoin rose from 49th to 34th position in terms of M1 money supply. https://t.co/bAj2IDIWBm pic.twitter.com/Au2QKx8Wvl
— Jameson Lopp (@lopp) December 30, 2019
From a relative historical standpoint, the overall change in exchange rate was mediocre.
Bitcoin average DAILY value change during:
— Jameson Lopp (@lopp) December 30, 2019
2010: +0.82%
2011: +0.76%
2012: +0.26%
2013: +1.11%
2014: -0.25%
2015: +0.09%
2016: +0.22%
2017: +0.78%
2018: -0.33%
2019: +0.18%
To calculate the above, use the formula:
Jan 1 exchange rate * (x³⁶⁵)=Dec 31 exchange rate
Bitcoin Trading
Both online and offline trading were fairly flat in BTC denominated terms.
2019 Localbitcoins trade volume was generally flat in BTC terms, though countries experiencing high inflation saw increases in fiat terms. https://t.co/qojo3YL82I pic.twitter.com/QeZjoYALkQ
— Jameson Lopp (@lopp) January 1, 2020
The number of Bitcoin ATMs increased 56% during 2019 to 6,387. https://t.co/rnryPGzRWQ pic.twitter.com/jZKFEHaelh
— Jameson Lopp (@lopp) January 1, 2020
Bitcoin trading volume was fairly flat throughout 2019. https://t.co/3nIlzwYjm7 pic.twitter.com/C2o8iat8WJ
— Jameson Lopp (@lopp) January 1, 2020
BitMEX uses an insurance fund to avoid Auto-Deleveraging in traders’ positions. The fund is used to aggress unfilled liquidation orders before they are taken over by the auto-deleveraging system. The insurance fund grows from liquidations that were able to be executed in the market at a price better than the bankruptcy price of that particular position. It would appear that a lot of margin traders got rekt on BitMEX in 2019.
The @BitMEXdotcom insurance fund grew 62% in 2019 and now holds 0.18% of all BTC. https://t.co/GZV1nt7Ltf pic.twitter.com/Cx7yDiMJLx
— Jameson Lopp (@lopp) December 26, 2019
Through the course of the year, ~$20 billion got liquidated on @BitMEXdotcom, a ~20% increase since last year.
— Unfolded (@cryptounfolded) December 29, 2019
Assuming an average leverage of 25x:
~$800 million of user funds got liquidation on BitMEX during 2019.
data: https://t.co/sIhSHD2UPJ | https://t.co/KBWo3n0CTo pic.twitter.com/OVJ1z4W2g2
Technical Development
At a protocol level, there was a great deal of work done in 2019. The Bitcoin Core and Lightning Network Daemon repositories were once again the most active.
2019 commits (excluding merges) & contributors:
— Jameson Lopp (@lopp) January 1, 2020
Bitcoin Core: 2,128 & 168
lnd: 2,134 & 84
c-lightning: 2,167 & 59
eclair: 288 & 13
bcoin: 242 & 13
rust-lightning: 210 & 12
btcd: 56 & 10
ptarmigan: 1,049 & 7
libbitcoin-system: 117 & 6
Source: calculated from the default development git branch of each repo.
git shortlog --after 2019-01-01 --summary --numbered --no-merges > contributors.txt
Conclusion
Most people are only familiar with the exchange rate of Bitcoin, if that. But exchange rate is just one of many metrics we can use to observe the evolution of this ecosystem. While any given metric can be gamed or may be taken from sources that aren’t 100% reliable, by using a diversity of metrics and sources we can get a rough idea of the trends in this space.
Bitcoin didn't blow anyone's expectations away in 2019; it made steady progress. Those of us who are dedicated to this system shall continue to BUIDL and add value; we have no control over the market but I expect that it will catch up to us sooner or later.
“Every day that goes by and Bitcoin hasn’t collapsed due to legal or technical problems, that brings new information to the market. It increases the chances of Bitcoin’s eventual success and justifies a higher price.” - Hal Finney